Project 1: Sibling Interviews · Grades 5–8
1.2 Anatomy of a Dataset
On YouTube as The Original Data Scientists: Antiquity's First Spreadsheets
Nisaba, who knows the names of things, sets them upon the tablet.
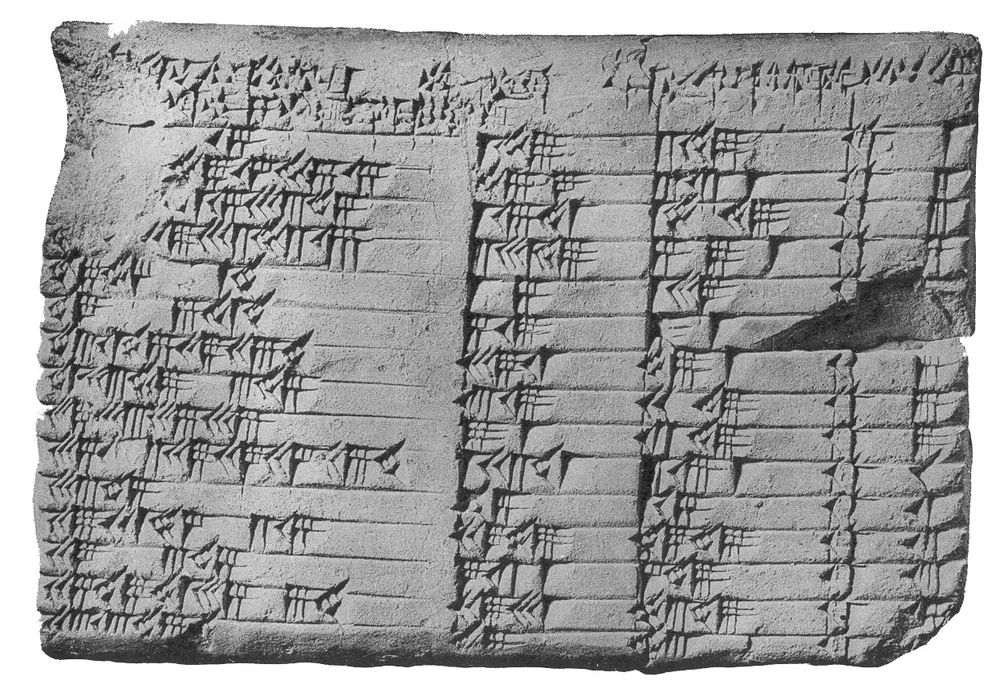
The table you built in 1.1 gets its proper statistical names. The lesson goes to the Louvre and to a corpus of Sumerian literature, exploring the oldest writings and tables that humanity has left behind.
What you will be able to do
- Name every part of a dataset the way a statistician, a scientist or an AI chatbot would: variable, observation, value.
- State the size of any dataset as n and k, and know which is which.
- Read a roughly 3,800-year-old tablet as a table, and say what its variables and observations are.
- Start your own concept table, the habit the rest of the course runs on.
What you need
The spreadsheet you built in Lesson 1.1. If you are joining without your own interviews, the lesson still makes sense, but the field task will not; Lesson 1.0 has the collection assignment.

What the lesson covers
- Variable, observation and value: the column, the row and the cell, renamed for what they mean rather than where they sit.
- We learn how we keep count of our observations and variables: n (the sample size, or count of rows) and k (the count of columns).
- The level of observation: what one row actually stands for. Here it is one person, because you interviewed people. A table of countries has one row per country, and a table of matches has one row per match. Getting this wrong is how analyses quietly go wrong.
- Proto-cuneiform, and the fact that numeracy came before literacy. The earliest tablets use pictographs and number marks to record how much of each ingredient went into how much beer, with a separate cell for each food item.
- A discussion of the motto and the history of data science. We talk about the importance of knowing the names of things in antiquity, and how that is still a durable skill, whereas the tools have changed drastically since then.
- So, we shouldn't expect Google Sheets to be around forever, but we can rely on the concepts we learn in these lessons to outlast the tools we use.
Concepts introduced
- Observation
- A complete record of the characteristics we observed about one person or thing.
- Variable
- A characteristic or question we record for each observation.
- Value
- A single data point.
- Dataset
- Data organized into a table so it can be analyzed.
- Level of observation
- What one row in a dataset stands for.
- Number of observations (n)
- How many observations a dataset has, written n. Also called the sample size.
- Number of variables (k)
- How many variables a dataset has, written k.
- Categorical variable
- A variable whose values are text.
- Numerical variable
- A variable whose values are numbers.
Field task
Name the parts of your own dataset. Count your observations to get n and your variables to get k, and write down your level of observation in plain words. Add the new concepts to your concept table. Bonus: describe your dataset to an AI chatbot using only the proper names, then ask it what questions your data could answer. Speaking the language precisely is what gets you a useful answer back.
The field task is not extra credit, it is the curriculum. The dataset the class analyzes later is the one you build here.
Going deeper
Keep going with a free account
The video above is open to everyone. The rest of Lesson 1.2, its practice questions and your saved progress come with a free account.
Accounts are for people 13 or older. Students in a class can join with their teacher’s code instead, and teachers and parents can make a free class dashboard.